Article topic: Epidemiology of Traumatic Brain Injury
Author: Noor Alosta
Scientific editor: Dr.Omar Jbara
Linguistic editors: Zain Alsaddi
OVERVIEW
Traumatic brain injury (TBI), usually referred to as “the silent epidemic”[1], is a critical health and socioeconomic problem that affects every society. It’s incidence is thought to be rising sharply worldwide due to the increased use of motor vehicles in middle and low-income countries. [2]
TBI remains a major public health concern as it is one of the greatest contributors to mortality and disability globally among all trauma-related injuries. Alongside its effect on the physical, psychological as well as financial aspect of the individual, it also inflicts a burden on the society as a whole.[3]
Definitions
As defined by the Centers for Disease Control and Prevention(CDC), epidemiology is the study of the determinants and distributions of health-related events in a specific population. Just like any other health issue, knowing the epidemiology of TBI is crucial in order to carry out a successful primary preventive measures.
Incidence of a specific condition refers to the occurrence rates of new cases of that condition or disease in a population over a specific period of time,according to the CDC. Therefore, the incidence of TBI measures its risk within a certain period of time. However, the prevalence of TBI measures the whole volume of people with TBI (including the incidence) at a known point in time or a period of time.
Mortality rate measures the number of deaths as a result of a specific disease in a given population compared to the overall size of that population in a chosen unit of time, which is usually one year. While the fatality rate of TBI refers to the number of deaths from TBI in relation to the number of patients suffering from TBI, expressed in a percentage. Thus, both the case fatality and mortality rates can be used as a rough estimate for the severity and outcome of a given condition or injury.
Limitations and Gaps in Studying the Epidemiology of TBI[4]
Efforts to measure the magnitude of the problem posed by TBI are limited by some factors. First, there’s a variation in the definition of TBI, as it is a heterogeneous disorder with multiple forms of presentation. It has been defined as brain damage that results from external forces, as a consequence of direct impact, rapid acceleration or deceleration, a penetrating object (e.g gunshot) or blast waves from an explosion. The nature, intensity, direction and duration of these forces determine the pattern and extent of damage.[2] Cases where subtle behavioral or neuropsychological changes, and injury-associated altered mental state, were reported after a possible trivial injury. As a result, the inclusion criteria that includes the presence of post-traumatic confusion or loss of consciousness as well as the presence of post- traumatic findings on imaging (CT or MRI) upon admission is variable in different studies. All of which results in a different estimate in the incidence and mortality rate, which cannot be compared between different studies.
Second, the total number of people suffering from TBI is underreported, as the majority of such patients have mild brain injuries, thus refrain from seeking medical treatment. Moreover, hospital recordings of unattended and emergency department-treated TBIs might be less consistent than the accurately reported cases of admitted patients. Other challenges include cases where TBI is undiagnosed or overlooked because it’s masked by an underlying more severe health condition. Additional bias is introduced because some pre-hospital fatal TBIs are not accounted for.
Third, the monitoring of TBI epidemiology is seldom performed in a standardized way and is absent in many parts of the world. The epidemiologic dates are mostly retrospective, retrieved from regularly collected administrative sources, for example, “ in the United States, CDC data are based on data from three different national sources: the National Vital Statistics System, the National Hospital Discharge Survey, and the National Hospital Ambulatory Medical Care Survey. In Europe, standard epidemiologic monitoring is lacking. Finland, however, has the oldest nation wide register in the world (established in 1967), and the computer-based Finnish Hospital Discharge Register provides some of the most reliable data within the European Union. Current initiatives include the Trauma Audit and Research Network (https:// www.tarn.ac.uk), established in the United Kingdom, whose aim is to collect data to inform acute response to trauma, and the Collaborative European NeuroTrauma Effectiveness Research in TBI (CENTER-TBI; https://www.center-tbi.eu), which is establishing a TBI registry of 15,000 to 25,000 patients from across Europe, as well as collecting detailed data on the clinical course of injury, treatment, and outcome for 5400 patients.”[4]
Even though these studies may provide insight into epidemiologic patterns, they were not designed to measure accurate data on incidence rates.
Fourth, when data is being collected, they are frequently identified by codes of the International Classification of Diseases (ICD) which are more pathologically based in the ICD-9 (ninth edition) classification, whereas it is more clinically oriented in the ICD-10(tenth edition). However, neither classification system measures reliable information about the severity of an injury, as both are primarily intended for administrative use and thus have substantial limitations.
Classification of Traumatic Brain Injury
Biochemical and pathological consequences of TBI are initiated by the physical insult. Therefore, the clinical manifestations of TBI depend largely on the nature of the insult. For example, many open-head injuries are caused by objects that penetrate the skull and damaging brain tissue. On the contrary, closed head injuries are associated with blunt or accelerative forces. [5]
The classification of TBI follows clinical severity and is assessed primarily with the Glasgow Coma Scale. [6] Its a scale with a score that ranges from 3 to 15 that consists of the sum of three component scores (eye, verbal, and motor scales) and offers a rapid evaluation of the severity of the brain injury (Table 1).[7] A score of 13-15 is considered a mild TBI, while 9-12 is moderate and a score ≤8 is classified as severe.[8]
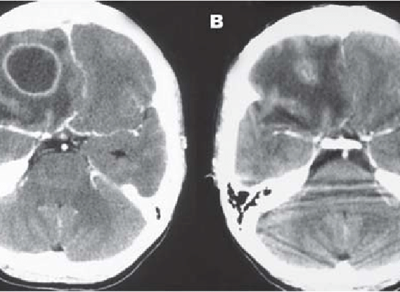
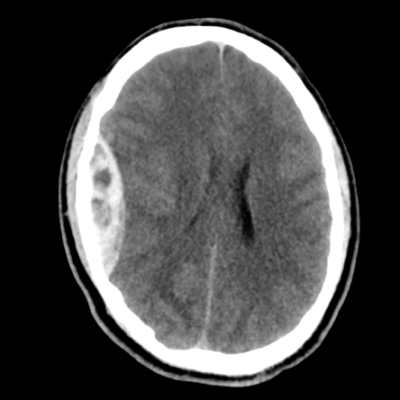
In addition to the Glasgow Coma Scale, TBI is further evaluated by various imaging modalities in order to establish the severity of structural damage in the brain. TBI can be classified into primary and secondary injuries.[9] Primary injuries occur at the time of the injury as a direct result of the traumatic impact, resulting in epidural or subdural-hematomas, micro-vascular injuries, contusions, and diffuse axonal injury. Secondary injuries occur hours or days later, and is generally a result of a complex cascade of biochemical events that often manifest as cerebral edema, elevated intracranial pressure, ischemia and infarction. [9]

The Effect of Traumatic Brain Injury from a Global Perspective
TBI is considered a major health and socioeconomic problem affecting all societies worldwide. In the United States alone, the cases of TBI in 2014 were estimated to be 1,565,000. The Emergency department witnessed 2,000,000 patient visits, approximately 300,000 hospital admissions and 51,000 deaths annually, along with the associated costs that may reach to, approximately, $76.5 billion or even higher. [10]
The World Health Organization (WHO) forecasts that by the year 2030, TBI will be a leading cause of disability and death across the world. [11]
Brain trauma accounts for roughly one third of all deaths from TBI and for the majority of permanent disabilities. [12] For each death, there will be dozens of hospitalizations, hundreds of emergency department admissions, and thousands of the doctor appointments. A large percentage of people who survive their injuries incur temporary or permanent disability across social, cognitive, behavioral, and physical functioning aspects.
Incidence and Population at Risk
The epidemiologic data that is reported in the literature should be interpreted with caution because of limitations and gaps in knowledge of the epidemiologic characteristics of TBI.Table 2 summarizes the most recent incidence rates reported around some regions of the world.
| Table 2 worldwide Incidences of Traumatic Brain Injury. |
|||
| Region | Incidence per 100, 00 population/ year of study. | ||
| USA |
|
||
| EU | For all TBI severities and all ages, crude incidence rates in Europe ranged from 47.3 per 100,000, to 694 per 100,000 population per year (in country-level studies) and 83.3 per 100,000, to 849 per 100,000 population per year (in regional-level studies). (2015) [14]
In another study, it was estimated that across Europe there is an average incidence of approximately 235 per 100,000, with most countries experiencing an incidence in the range of 150–300 / 100,000 per year.(2005) [15]
|
||
| UK | An overall rate of 453 per 100,000 was found for all head injuries in the UK, of which 40 per 100,000 (10.9%) were moderate to severe. (2006) [16]
|
||
| New Zealand | The total incidence of TBI per 100,000 person-years was 790 cases (2013) [18], of which ;
|
||
| Australia | Incidence rates were estimated to be 99.1/100,000 population. 2019 [19] | ||
| Taiwan | The age-adjusted incidence rate of head injury in Taiwan was 382/100 000; 499/100 000 of which for males and 244/100 000 for females. (1995)[20] |
||
| India | The annual incidence rate of head injuries is approximately 55 per 100,000 (2008). [21]
|
||
| Pakistan | The annual incidence of head injured patients admitted to various neurosurgical centers in Pakistan was 50 per 100,000 populations per year. (2001) [22] | ||
CDC. |
|||
The above table illustrates the variation in reported incidence rates, primarily caused by varying definitions of injury, different inclusion criteria, in addition to sampling errors and actual differences. [23]
The CDC uses the ICD codes to identify cases of TBI and collects data on TBI-related emergency department visits, hospitalizations, and deaths. In a report published in 2010 by Faul and associates,[24] they collected CDC data for the years 2002 to 2006 and concluded that an estimate of 1.7 million people sustain TBI annually. Of these, only 0.7% of ended up in the emergency department, while 16.3% were hospitalized and 3% died.
The TBI rates in the United States increased from 616 in 2005 and to 824 per 100,000 in 2010. The large increase was corelated chiefly to increased TBI-related visits to emergency departments,mainly by children and older adults. This may indicate that the increase is related to improved diagnostic methods or to an increase in the awareness of the importance of TBI among the general population, however it is still uncertain.[25]
In Europe, a study by Tagliaferri and associates, reported an overall incidence of 235 per 100,000, derived from a systematic review of 23 reports on national and regional epidemiologic studies of TBI. Wide variation was found in reported incidences, ranging from 20 per 100,000 for neurosurgical cases only to 546 per 100,000 including emergency department visits, hospital discharge, and coroner reports.[26] Nevertheless, major variations across studies were shown, with extremes ranging from 47.3 per 100,000 to 546.0 per 100,000.[27,28]
Similarly, In Australia, a pattern of varying incidence rates has been described; estimated annual rates varied widely from 57 per 100,000 to 322 per 100,000.[29] This range of estimates is broad and is influenced by significant methodological variation among studies.
Incidence rates from Asian countries, on the other hand, are infrequently published. In India for instance, an incidence of 120 per 100,000 was found among hospital-based victims. [30] A more conservative estimate in 2002 was given by Gururaj[31], who reported that nearly 1.5 million to 2 million individuals sustain a TBI annually.
Population at Risk
A study by Albrecht. etal. in 2019 provided evidence that over a 4-year period of following up older adults, any severe to moderate injury is associated with increased mortality risk.
Specifically, older injured adults are at higher risk of death from accidental and thus preventable causes, suggesting that proper intervention could reduce mortality.[32] Elderly patients, military personnel and children (aged 0-4 years) were found to be at particular risk for TBI,[33] [34] Another study in New Zealand found that children and adolescents (aged 0-14 years) and young adults (aged 15-34 years) constituted almost 70% of all TBI cases.[18]
A study by Morrel et al. indicated that a large percentage of people detained in penitentiary institutes reported a history of “head” injury.[35] In another study done by Ivins and associates, it was reported that up to 23% of service members on noncombat active duty had suffered some form of TBI during their military service. [36] It was stated by Ling and Eklund, that explosive blasts had emerged as a leading cause of combat-related TBI. [37] The overall incidence rate of TBI among service members on active duty more than doubled between the years 2000 (720.3 per 100,000) and 2011 (1811 per 100,000), which may reflect an actual increase in TBI, but may also reflect deployment of an increased number of members, along with increased awareness of the need to seek out care and to improve recognition and diagnosis.[38]
Causes of TBI
The major causes of TBI are transportation accidents, falls, and gunshot wounds that are caused by misadventure, violence or carelessness and reflect societal behavior.
Gilbert stated that the motorcar “had emerged as the most persistent killer in the western world.”[39] Road traffic injuries place an enormous strain on any country’s health care system and national economy in general. The mechanism of TBI sustained in road traffic accidents in high-income countries is markedly different from that in low- and middle-income countries. In high-income countries, the victims are commonly young adult drivers, while in low- and middle-income countries, the victims are much more frequently vulnerable road users (e.g., pedestrians, cyclists, motor-cyclists, and users of public transport). The observation that vulnerable road users are the primary victims of TBI suggests that it is possibly not so much reckless driving but rather unawareness of traffic risks in the general population. Accordingly, perhaps it may be better to aim prevention campaigns in these countries more towards the general population.For example, in Pakistan,[40]most people who sustain TBI in road traffic incidents are pedestrians hit by a vehicle and people falling from a moving vehicle.
In a study by Hyder and colleagues, they summarized the epidemiologic characteristics of TBI in a worldwide context and reported that in general 62% of TBIs are caused by road traffic accidents, approximately 24% by violence, 8% by falls and, and only 4% result from work- and sports-related injuries.[41]
Other causes of trauma also showed regional variations and changing trends. In the United States for instance, injuries related to firearms exceeded those from road traffic incidents for the first time in 1990, and this trend contrasted with the decrease in deaths from road traffic incidents[42], and more than half of cranial gunshot wounds represented suicidal attempts.[43]
Sport and recreation-related TBIs are being recognized more frequently. In the United States, the CDC estimated that between 1.6 and 3.8 million sports-related TBIs occur yearly; including injuries for which no medical care was sought.[44]Particular attention is being focused on secondary prevention because repetitive concussions may have cumulative effects resulting from increased vulnerability of the brain after earlier injury. A study conducted in New Zealand found that 21%of all TBIs have been sustained during a sports-related activity; the highest rates were observed in rugby, cycling, and equestrian activities.[45]
Mortality Rates
Because of the huge variability in data collection and lack of standardization, comparison of mortality rates between different studies, even the ones done in the same region, is nearly impossible.
The average mortality rate in Europe is reported to be approximately 15 per 100,000.[46]However, this rate ranges from 5.2 per 100,000 in a population in France[47] in which only in-hospital deaths after severe TBI were counted, to 24.4 per 100,000 in a province in Italy in which all in-hospital and pre-hospital deaths were recorded.[48]Another study in Europe showed that crude mortality rates ranged from 9 to 28.10 per 100,000 population per year (on a country-level studies), and 3.3 to 24.4 per 100,000 population per year (for regional-level studies.).[49]
In the United States, Adekoya and colleagues and Rutland-Brown and associates reported a decrease in TBI related deaths from 24.6 in 1997 to 17.5 per 100,000 in 2003.[50][51] A more recent study by Coronado and associates reported a decrease in TBI-related deaths by 8.2% during the period 1997 through 2007 in the United States.[52] The decreases in death and disability rates after TBI in western society are considered to be the result of collective effects of proper prevention, improvement of emergency health systems, trauma organization and implementation of guidelines. However, in patients older than 75 years, a significant increase in TBI-related deaths was found.[52]
In Australia, despite a 40% increase in population and an increase in the number of registered vehicles by 120%, the fatality rate from road traffic accidents decreased by 47% between 1970 and 1995.[53] This decrease coincided with the recognition of the importance of public education and the implementation of a uniform code of road safety, backed by legislation and police reinforcement. However, opinion is divided; some authors believe that there has been no clear decrease in mortality since the 1990s. [54]
In a more recent study of hospitalized traumatic brain injury in the state of New South Wales, Australia; mortality rate was estimated to be of 5.9 per 100,000 populations. [55]
Evidence of elevated long term risk for premature mortality in people experiencing a TBI have has also been revealed. This is particularly in cases of suicide attempts, injuries, and assaults, even after adjustment for socio-demographic and familial factors 6 months after injury.[56]
The average life expectancy is decreased by 9 years after inpatient rehabilitation from TBI.[57] Among people who have suffered a TBI, the annual mortality rate remains high, up to approximately seven folds, for at least 13 years.[58]